The Modern Data-driven Innovation Program
The program at a glance
What: A 10-module program teaching R&D specialists to reduce development uncertainty and accelerate discovery through systematic experimental design and modern data-driven decision making.
Why: Companies that use data-driven methods gain competitive advantage by higher innovation success rates, reduced development risk and faster time-to-discovery in uncertain environments.
Who: R&D specialists, product developers, and innovation managers who need to create new knowledge and navigate uncertainty rather than only optimize existing processes.
How: Year-long collaborative learning with immediate application to participants’ own projects, supported by peer learning across multiple companies and leadership involvement.
On this page:
- Target audience and value
- Program format, modules and timeline
- What makes this program different
- Pricing
- Software tools
- How is this different from Six Sigma?
- Detailed learning goals
Target audience and value
R&D professionals and innovation teams who need to reduce development uncertainty, accelerate discovery and create new knowledge rather than only optimizing existing processes.
Specific roles:
- Product developers/engineers and research scientists (2-10 years experience)
- R&D project leaders transitioning from technical to strategic thinking
- Innovation managers making go/no-go decisions under uncertainty
- Technical specialists moving from laboratory work to systematic investigation
Prerequisites:
- Most important: Active involvement in development/innovation projects with uncertain outcomes
- Basic statistical training (STEM statistics, Six Sigma green belt or equivalent)
- Access to experimental systems (laboratory, pilot, or development environment)
The statistical methods we teach are accessible and practical – the complexity lies in organizational implementation, not mathematical sophistication. Experienced practitioners will see tools applied to fundamentally different innovation challenges, while newer practitioners will find the statistical foundations approachable and immediately applicable.
Companies typically see value through:
- More predictable R&D outcomes, with clearer go/no-go decision points
- Reduced project risk, by identifying dead-ends earlier in development
- Better resource allocation, across innovation portfolios
- Faster knowledge transfer, from R&D to production teams
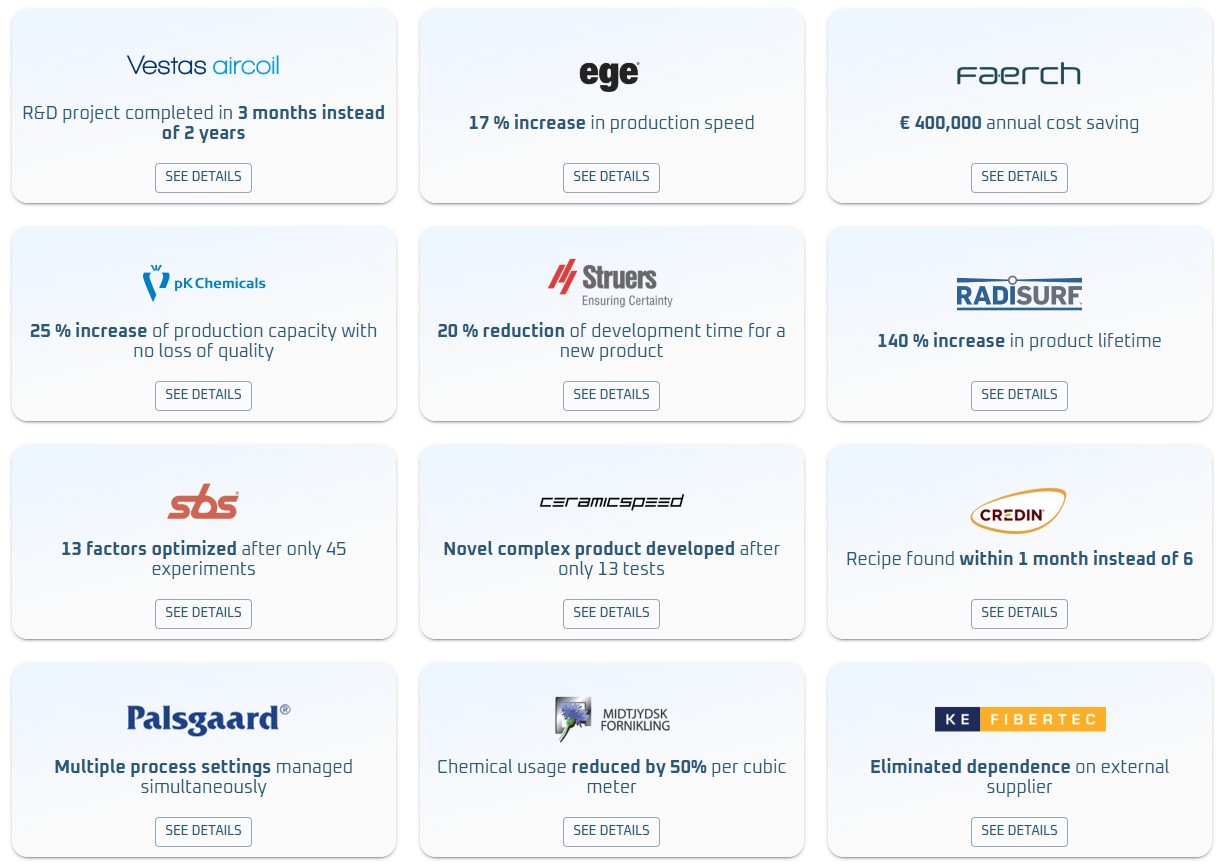
Value created at companies that we have helped implement the tools taught in this program:

Program format, modules and timeline
The program combines 10 individual modules with continuous peer and expert support designed for immediate application to participants’ real innovation projects. The year-long format allows multiple iterations and applications of methods on actual business challenges.
Core learning structure:
- 10 on-site modules (about one per month) providing frameworks, tools and methods
- Monthly open office sessions for ongoing project support and peer learning
- Continuous application to participants’ own innovation challenges between sessions
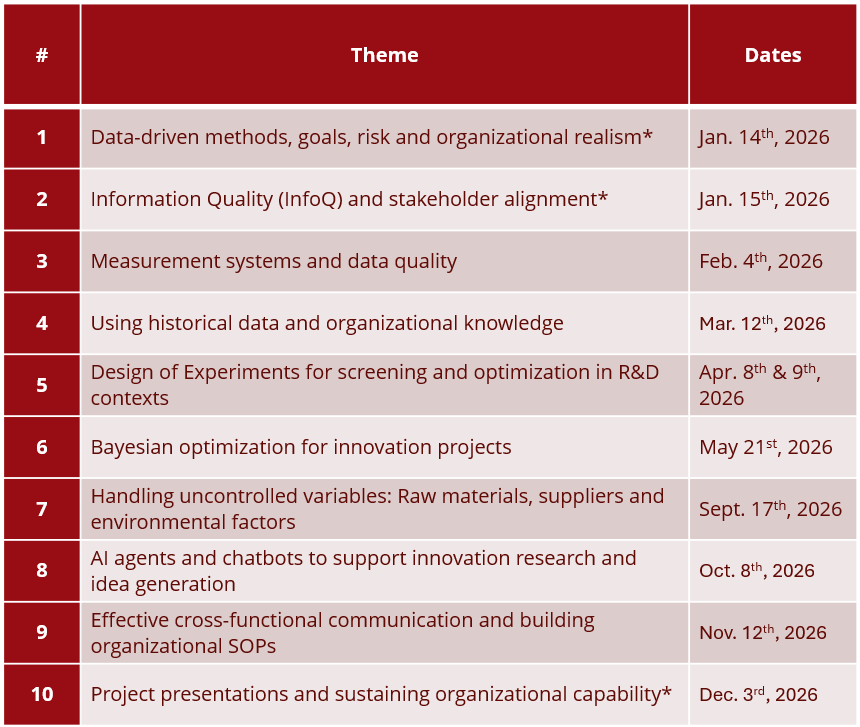
Themes and provisional dates for each module are shown in the table below.

*Modules intended for both specialists and their closest manager.
Continuous support between modules: The program’s open office sessions are a core feature, not an add-on. These monthly sessions provide:
- Peer feedback on participants’ ongoing experiments and challenges
- Instructor guidance on adapting methods to specific company contexts
- Cross-company learning from real implementation experiences
- Problem-solving support for practical obstacles participants encounter
Every on-site module sets aside time for participants to present progress, share challenges and receive feedback from peers facing similar innovation problems across different companies.
Practical details: Each modules lasts 9:00-16:00 at the Danish Technological Institute, Kongsvang Allé 29, 8000 Aarhus C. The program is conducted in English. Schedule changes may occur with sufficient advance notice.
Additional Clarification for Module 8: This module focuses on generative AI tools for research support and ideation - not quantitative analysis or experimental design. Topics include AI agents for literature review, technology scouting, quality measurement ideation, and research brainstorming. Quantitative experimental work remains the domain of DOE and Bayesian optimization.
What makes this program different
This is not a traditional classroom course – it is collaborative capability building. Participants learn methods, apply them immediately to real projects, troubleshoot the inevitable implementation challenges with peers and refine their approach through multiple cycles. We know from experience that the combination of structured learning and continuous peer support is much better suited to create lasting organizational change, not just individual skills.
The collaborative approach delivers measurable organizational benefits:
- Participants apply methods to real business challenges during the program, generating immediate value
- Peer learning across companies accelerates problem-solving and reduces implementation risk
- Continuous support ensures methods are adapted successfully to each organization’s specific context
- Manager involvement at key points ensures organizational alignment and sustained adoption
Pricing
The cost per company depends on the number of participants. There is a strong discount for sending multiple participants as we wish to encourage companies to build a critical mass of internal capability.
- 1 Specialist and nearest manager: 45.000 DKK
- 2 Specialists and nearest manager: 75.000 DKK
- 3 Specialists and nearest manager: 95.000 DKK
- Per extra specialist after 3 total: 20.000 DKK
Software tools
Over the course of the program, we will make use of the following software packages:
- Excel, for basic data handling
- Design Expert or equivalent DOE software
- Brownie Bee, for Bayesian Optimization
If you do not already have access to relevant software, please allow for an additional cost of approx. $1140 for Design Expert and approx. €828 for Brownie Bee. We can assist with software selection and procurement guidance.
How is this different from Six Sigma?
While Six Sigma excellence optimizes what you know works, this program accelerates discovering what will work next.
This program focuses on end-to-end data-driven innovation – moving from business problems to experimental strategy, using new and historical data to iteratively develop products and processes.
Key differences:
- Forward-looking: Six Sigma improves existing processes; we discover new possibilities
- Exploration focus: Six Sigma maximizes known processes; we explore unknown solution spaces
- Smart risk taking: Six Sigma minimizes variation; R&D requires learning from intelligent "failures”
- Innovation metrics: Six Sigma measures defect reduction; we measure knowledge gain and time-to-discovery
For Six Sigma practitioners: The statistical tools (DOE, optimization) are familiar, but their application in R&D contexts addresses fundamentally different questions – exploring unknowns rather than optimizing knowns. The challenge isn’t statistical complexity, but navigating organizational realities, uncontrolled variables and innovation-specific risks.
Detailed learning goals
Topic: From business problem to experimental plan and organizational alignment. After the program, participants can:
- Convert real-world project goals to structured experiments that balance stakeholder needs across departments
- Scope and design experiments that fit practical organizational constraints
- Quantify desired improvements, translate them to business value and communicate trade-offs to different organizational levels
- Navigate conflicting goals from R&D, production, quality and commercial teams when designing experimental strategies
Topic: Experimental design in organizational context. After the program, participants can:
- Choose experimental designs appropriate for R&D innovation challenges (vs. process optimization)
- Balance experiment cost against information gain while accounting for organizational risk tolerance
- Build on historical data and diagnose when existing data quality supports experimental goals
- Design experiments that fit into existing workflows and systems
Topic: Risk management and stakeholder communication. After the program, participants can:
- Balance the trade-off between resource investment and risk of not finding solutions in ways that align with organizational strategy
- Ensure analytical questions can be answered within budget and timeline constraints
- Communicate experimental uncertainties and potential outcomes to management and other departments
- Build support for data-driven approaches among colleagues and leadership
Topic: Measurement systems analysis and organizational data quality. After the program, participants can:
- Evaluate data quality before running experiments, in collaboration with R&D, production, quality and IT teams
- Understand sources of variability across organizational boundaries and implement mitigating strategies
- Implement low-cost data quality improvements that work within existing organizational structures
- Provide technical input on data governance to serve both innovation needs and compliance requirements
Topic: Analysis, conclusions and communication. After the program, participants can:
- Analyze and interpret results of experiments with statistical rigor and translate findings to different organizational audiences
- Identify when to expand, pivot or stop experiments based on both statistical and business criteria
- Translate from scientific conclusions to business conclusions and make clear recommendations for management
- Create compelling case studies that drive further adoption of data-driven methods
- Build bridges between R&D discoveries and implementation teams (production, quality, commercial)
Topic: Sustainable implementation and organizational change. After the program, participants can:
- Implement methods in ways that build organizational capability rather than individual expertise
- Design low-risk pilot experiments that demonstrate value and build organizational confidence
- Create workflows and SOPs that embed data-driven thinking into routine organizational processes
Coach colleagues and build internal networks that sustain data-driven innovation practices